
Using Simple XML source code to build dashboards in Splunk doesn’t have to be complicated.
Here are five of the best tips and tricks for improved dashboarding.
Jump to section:
- Fixing the Base Search Gotcha
- Creating Hidden Searches
- Utilizing Tokens
- Stylizing Dashboards With HTML
- Lesser-Known Dashboard Settings
1. Fixing the Base Search Gotcha
Base searches reduce the number of large searches on a dashboard by running a single search and then having subsequent searches pull from its results.
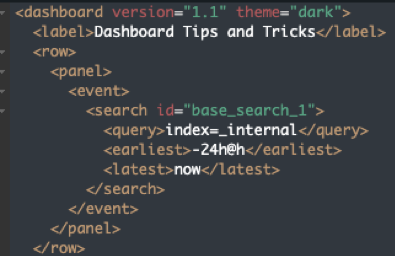
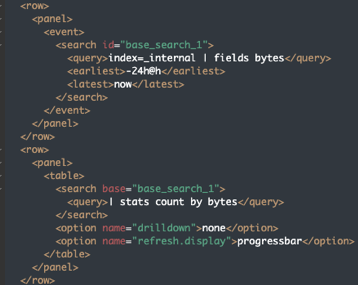
To turn a search into a base search, simply add id=“<base search name>” to the search tags in the source of the XML. Replace <base search name> with a label for the base search.
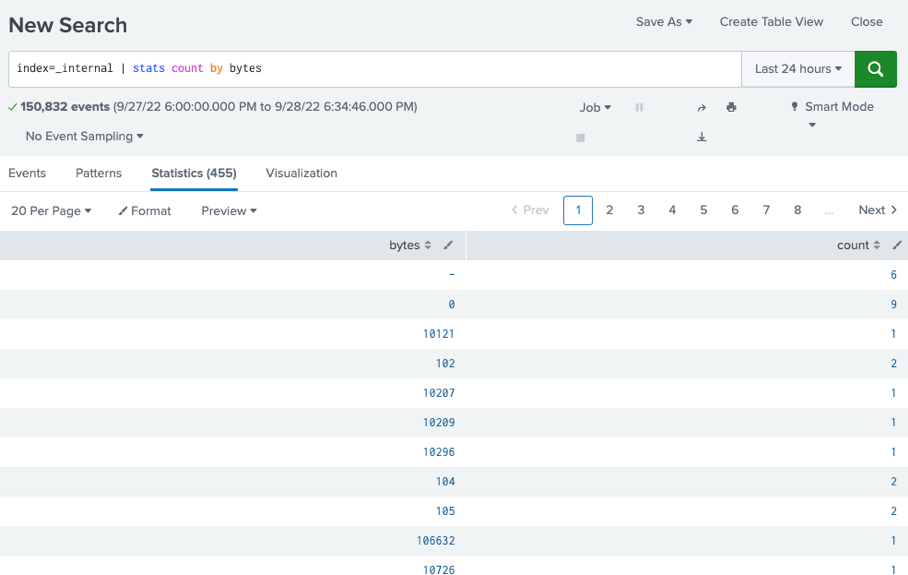
For instance, in the screenshot below, I’m using the label “base_search_1”:
To then have a second search use the results from the base search, add base=“<base search name>” to the search tags of that second search:
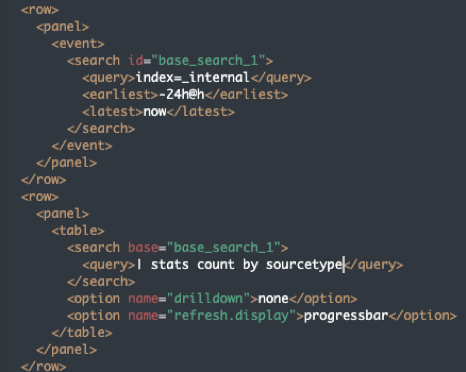
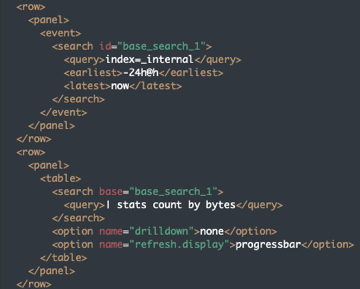
The above example will work without any issues, but if we change the “by” field in the stats command of the second search from “sourcetype” to a search time field instead of an indexed field, the second search will always return no results.
This is a bit of a gotcha of base searches.
This is because on a dashboard, ALL searches are run in fast mode, meaning they’ll only return:
- Indexed fields
- Fields specifically called out in a fields or table command
- Fields that are the output of a transforming command like stats, tstats, timechart, chart, etc.
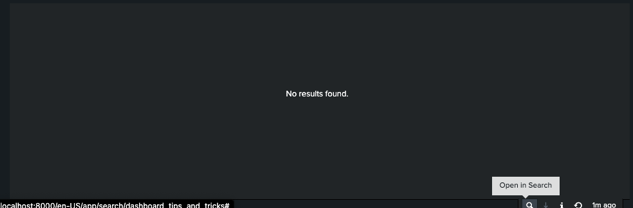
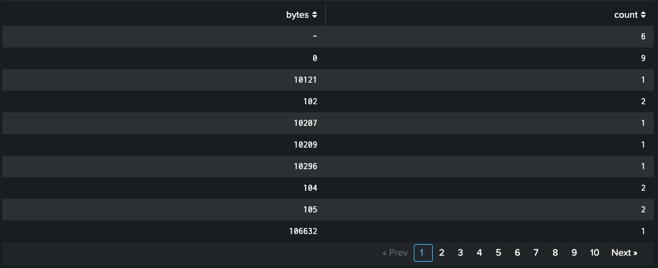
Although the dashboard shows no results, if we click “open in search,” we do get results:
So, what’s the workaround for this?
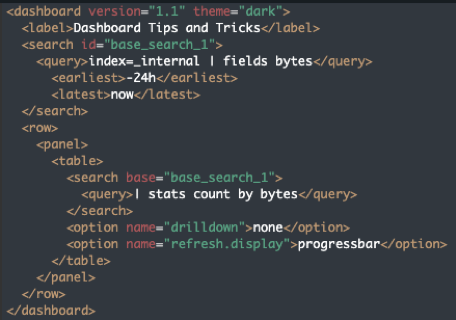
It’s simple — just make sure you have either a “fields” command or one of the transforming commands on the end of the base search that includes the field(s) you plan on using in the second search:
2. Creating Hidden Searches
Sometimes you may want to pull results from multiple panels of a base search, but you don’t actually want to display the base search results.
To achieve this, simply make that base search a background search.
It will run when the dashboard is opened, but the users will never see it. In the source code, you simply create search tags outside of a row and panel:
3. Utilizing Tokens
Tokens are an insanely powerful component of dashboards.
Inputs in dashboards require a token value that you then use in searches and other inputs. To add token values to your searches, just use field=“$<token name>$”.
Finalized Search Tokens
Ever wanted to take the output of one search and feed it to another search?
This is easy to do with finalized search tokens.
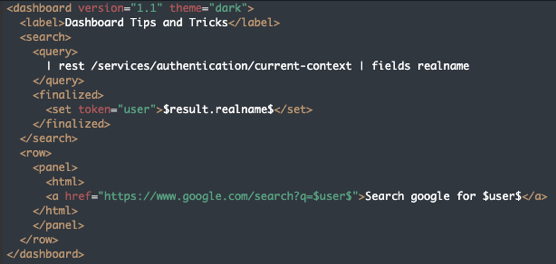
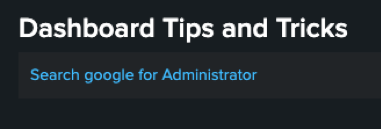
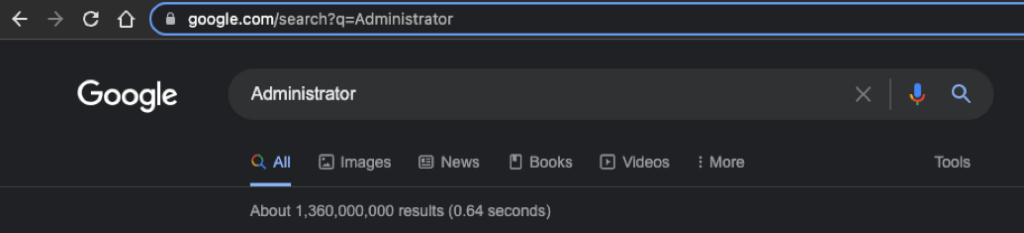
To create the token, you’ll need to add some <finalized> tags to your search in the source XML and then add some <set> tags inside of the finalized tags.
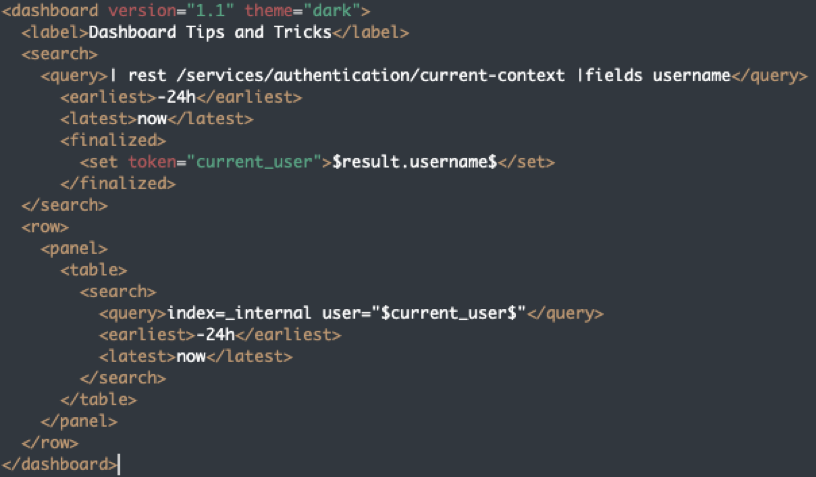
For example, let’s create a base search that pulls the username of the currently logged in user. We’ll then use this in another search to find results from the _internal index where that user was involved.
We’ll use a rest search to grab the user which will return the “username” field and grab that field using a built-in token mechanism, $result.<field name>$:
Drilldown Tokens
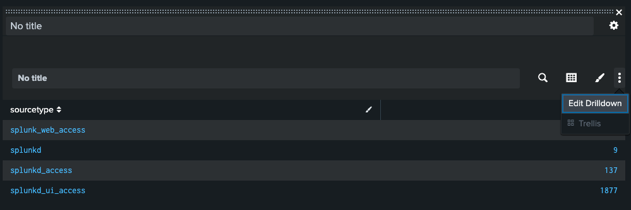
Drilldown tokens allow you to click a row or value on a dashboard and immediately save that value or a specific row value to a token to be used later.
To create these tokens, we’ll actually use the graphical user interface (GUI) entirely.
First, open the Drilldown Editor and select the “manage tokens on this dashboard” option for the specific panel:
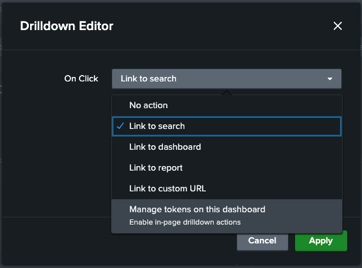
You’ll then arrive at this pop-up menu:
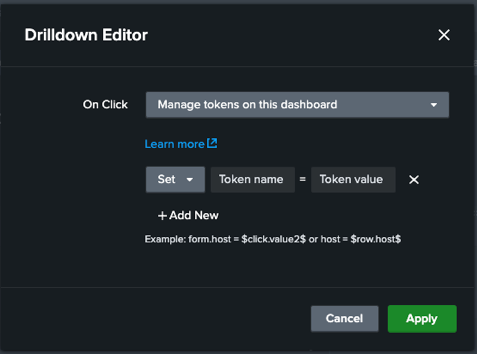
There are quite a few options, but I’ve found that the two most important are $click.value2$ and $row.<fieldname>$.
$click.value2$ is pretty simple. Just select it, and when you click a value in a table, the token is set to the value of whichever cell in the table you clicked.
$row.<fieldname>$ requires a bit more setup.
You’ll first need to replace <fieldname> with the field that you want to pull the value from in the row you click.
You can then click on ANY cell in the row and the token will get set to that value.
One useful example is if you have a panel of users with counts of failed logins. You can add a drilldown for $row.user$ to grab the “user” field value for whichever row you click and then pass that token to another panel where you search for more context for that specific user.
Hiding Panels
Hiding or showing panels based on whether or not a token is set can be extremely helpful.
All you have to do is add a token as a “depends” or “rejects” value in a panel tag.
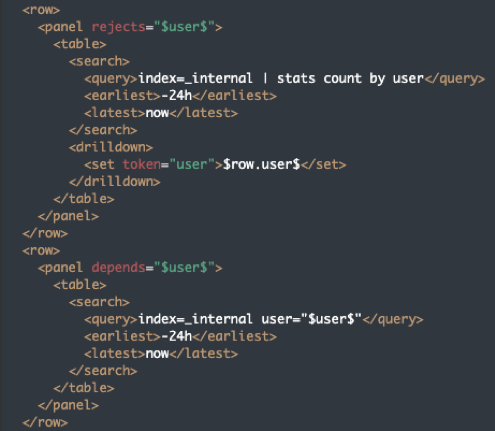
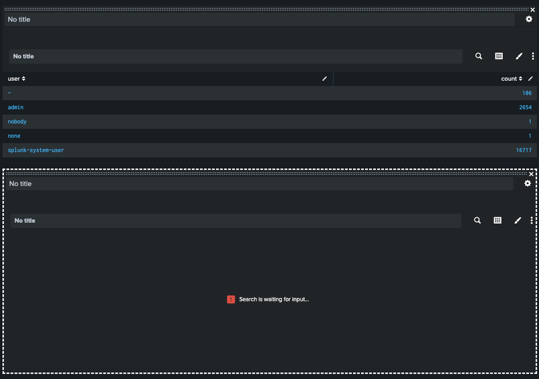
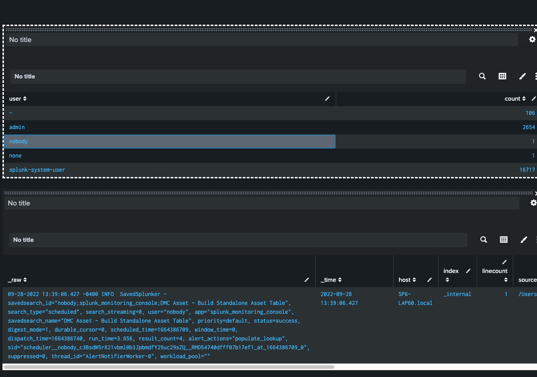
Here’s a fun example where we run a search to get a list of users, and then when we drill down into a row, it sets a “user” token. The panel generating the list of users is set to be hidden when the token is set and the drilldown panel is set to be hidden when the user token is unset.
So, as soon as you click a row, the first panel disappears and the second panel is revealed:
When in edit mode on a dashboard, it will show hidden panels by placing a dotted line around the panel to show that it’s hidden.
Here’s the GUI in edit mode (before and after clicking a row) for the above XML:
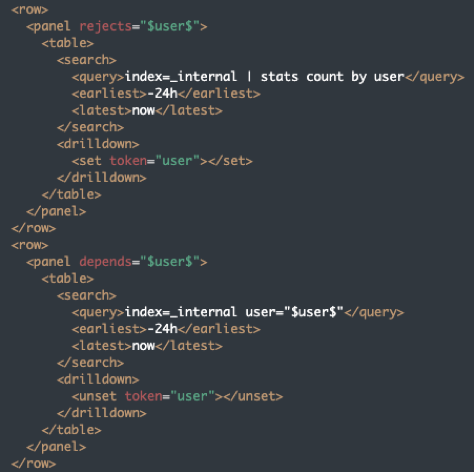
Set/Unset Tokens
Tokens can be set using set and unset tags. While you can set a value to a token when setting it, you don’t actually have to.
To use tokens to show and hide panels without actually giving them a value, just use <set token=”<token name>”></set> and the token will be set.
In the following code, when you click on a row, it will set the “user” token without a value. This will cause the first panel to become hidden and the second panel to show. Because the second panel requires a value for the token, however, the panel will end up running the search: index=_internal user=””
4. Stylizing Dashboards With HTML
Ever wanted to add a large block of text to a dashboard, maybe with some flashy formatting? Or a picture you found online?
You can do that using <html> tags.
Add Text
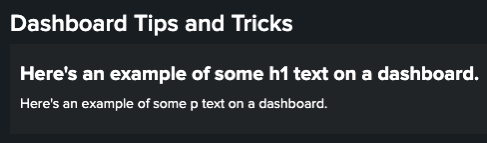
My go-tos for dashboard text are <p> and <h1> tags inside of <html> tags in a dashboard panel:

You can add styling and colors as well:
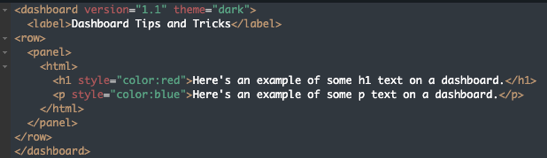
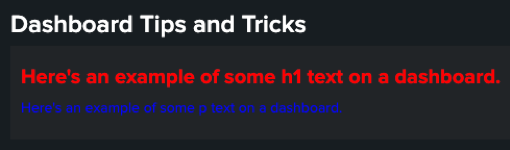
Here are some more styling options.
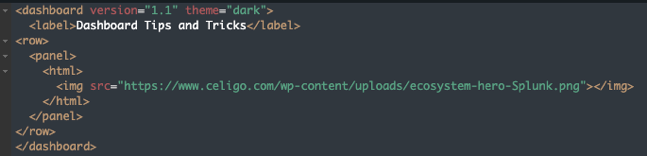
Add Pictures
The <img> tag with the source URL of an image is all you need to add an image to a dashboard:
Add Dynamic Links
Adding URL links to dashboards is easy. Just use <a href=”url”>link text</a>.
To take it a step further, you can also create dynamic links using the results of a search:
5. Lesser-Known Dashboard Settings
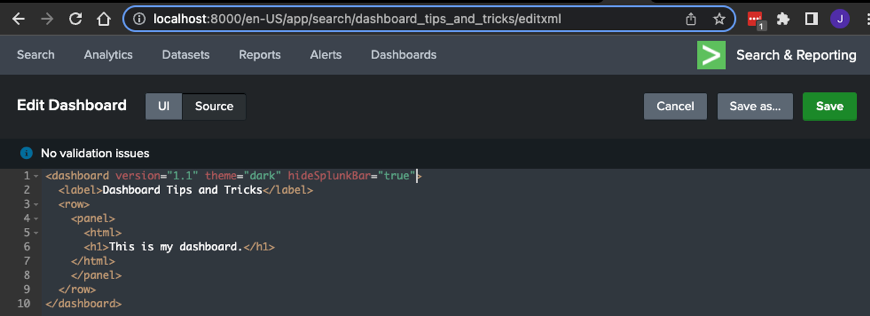
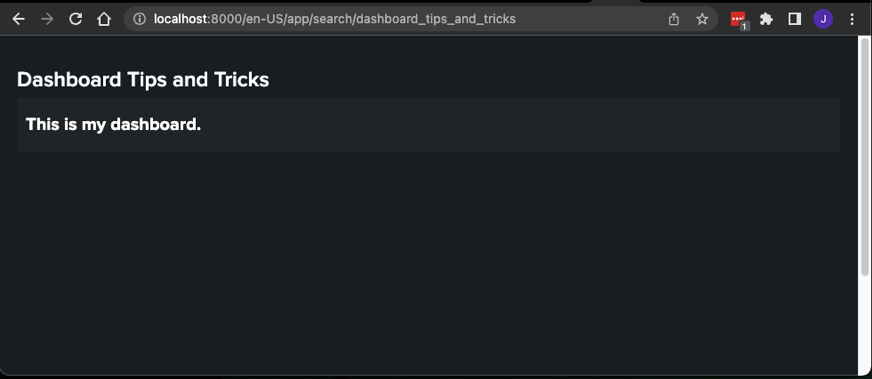
Ever want to hide the Splunkbar — the bar with the Apps dropdown, your user preferences, Messages, Settings, Activity, and Help — at the top of the browser window?
You can add the “hideSplunkBar” setting to the initial tags on the dashboard to hide it, and it will work the moment you type it in. You don’t even have to save the dashboard.

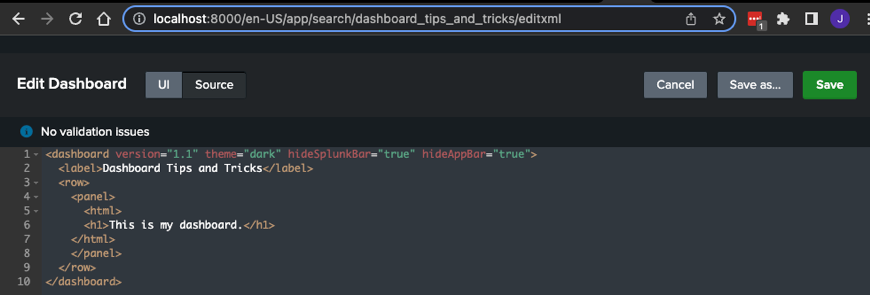
You can hide the App navigation bar as well with “hideAppBar”:
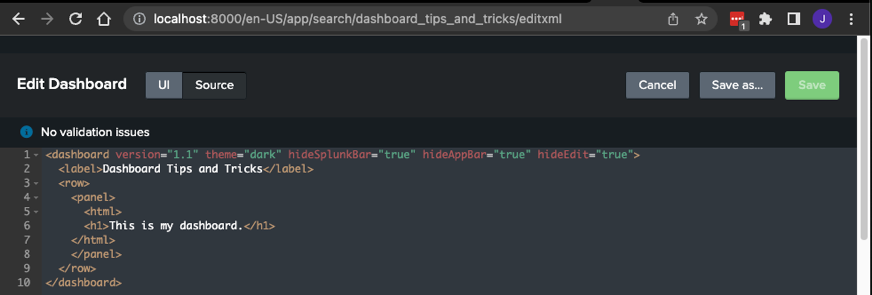
You can even hide the Edit button with “hideEdit.” Just remember that if you need to edit the dashboard again after you hide the edit button, you’ll have to add “/edit” to the site address in the address bar in the browser:
Get More Out of Splunk With SP6
Want to take your Splunk XML dashboarding even further?
Schedule a consultation with SP6 today to learn how our top-rated Splunk team — recognized as one of North America’s largest and most accomplished — can make your data more secure, compliant, and performant.
SP6 is a niche technology firm advising organizations on how to best leverage the combination of big data analytics and automation across distinct (3) practice areas:
- Cybersecurity Operations and Cyber Risk Management (including automated security compliance and security maturity assessments)
- Fraud detection and prevention
- IT and DevOps Observability and Site Reliability
Each of these distinct domains is supported by SP6 team members with subject matter expertise in their respective disciplines. SP6 provides Professional Services as well as ongoing Co-Managed Services in each of these solution areas. We also assist organizations in their evaluation and acquisition of appropriate technology tools and solutions. SP6 operates across North America and Europe.